Summary Tab
Summary Tab
#38xxx
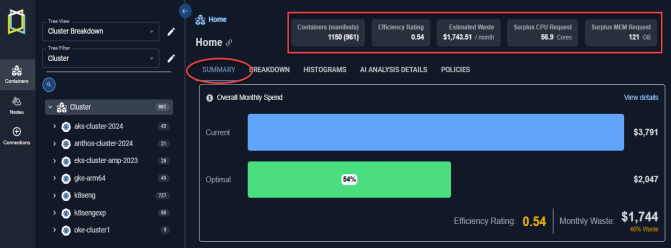
This tab provides a simplified landing page that allows you to quickly understand the optimization potential in your Kubernetes environments.
The charts provide a clear breakdown of how optimization recommendations can provide immediate savings, the impact of taking those recommendations to reduce risk in your environment, and what additional waste can be safely removed once you have eliminated the identified risks.
The content on this tab is based on your selection in the tree viewer.
Figure: Locating the Summary Tab
When a single container is selected you will see the Overview and Metrics Viewer tabs.
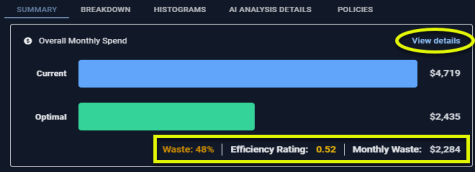
Current Monthly Spend
This first chart summarizes your current spend and breaks down CPU and memory spending. A hyperlinked value in the upper corner takes you to the AI Analysis Details tab with same scope of systems selected.
Figure: Overall Monthly Spend
Unit Costs
The default unit cost of CPU core and memory GB is shown here. These values are used for all cost calculations. The values are configurable.
Monthly Waste
This block shows you wasted resources as a dollar amount broken down by CPU and memory requests. These histogram charts show your data grouped as a distribution. The scope of data, is defined by the tree viewer. The link on the right side of each chart takes you to the histogram page, with same scope of systems selected.
Figure: Monthly Waste
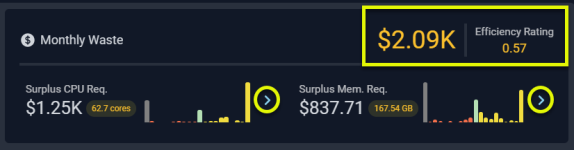
Efficiency Rating
The Efficiency Rating provides an indication of the health of your aggregated environment.
- A value of 1 indicates that, at an aggregate level, the environment is efficient according to the defined policy settings.
- A value less than 1 indicates potential savings opportunities due to over-allocated resources.
- A value greater than 1 indicates potential risks due to under-allocated resources. The value is indicated in red, when it is greater than 1.
Containers with unspecified values are not included in this calculation.
GPU Summary
Your GPU spend and allocation are summarized on this card.
Figure: GPU Summary

|
Column |
Description |
|---|---|
|
GPU Monthly Spend |
The dollar amount spent on GPUs for the scope of systems selected in the tree viewer. |
|
Containers |
The number of containers with specified GPU request values. Click the hyperlink to open the AI Analysis Details page with the utilization details. |
|
Total GPU Request |
The total number of GPUs requested for the scope of systems selected in the tree viewer. |
|
Total GPU Memory |
The total available GPU memory available. |
Click the hyperlink, in the note, to view GPU pricing details. This table provides visibility into how the cost is calculated. The cost per GPU might change greatly depending on the model, so this table provides the model details.
Figure: GPU Unit Pricing
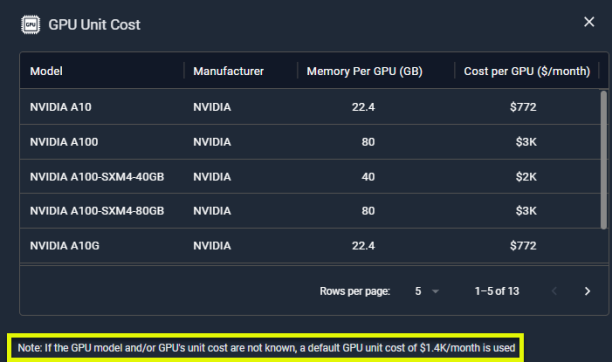
If the GPU model and/or GPU unit cost are unknown, a default GPU unit cost of $1.4K/month is used for the calculations. This value is configurable. Contact [email protected] for details.
Optimization Breakdown
This bar chart shows the breakdown of your container spending:
Figure: Optimization Breakdown
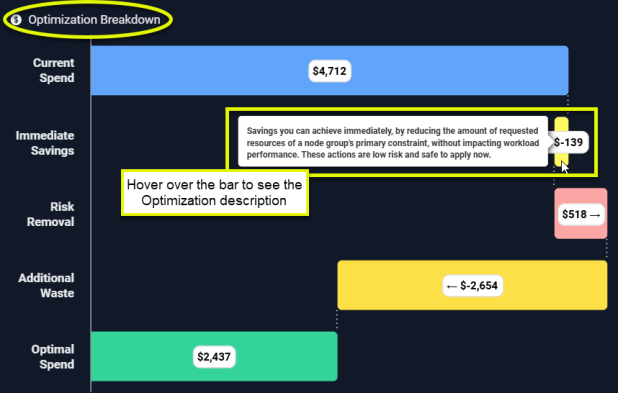
Hover over any of the bars to see a description of the recommended optimization.
|
Column |
Description |
|---|---|
|
Current Spend |
The bar shows you what you are currently spending on the infrastructure that has been selected in the tree viewer. This value includes containers with unspecified CPU and/or memory request. See Containers with Unspecified Settings for details. |
|
Immediate Savings |
Immediate savings can be achieved by adjusting the requested settings for containers within Node Groups where CPU or memory requests are the primary constraint. Adjusting these settings does not impact workload performance. A container qualifies for immediate savings if the "% of Nodes with CPU Saturation" is below a predefined threshold. For example, if the threshold is set at 50%, only containers where "% of Nodes with CPU Saturation" is less than 50% should be considered. Immediate savings can be achieved by adjusting the Memory Request settings only for containers within Node Groups where Memory Request" is the primary constraint. Calculated as: Sum of immediate CPU savings + Sum of immediate memory savings |
|
Risk Removal |
The incurred cost to reduce or eliminate resourcing shortfalls that may be causing application restarts, CPU throttling or memory events, including OOM kills. CPU and memory shortfalls are aggregated for all containers in the selected scope and used to determine this value. Calculated as: Sum(Shortfall CPU<0 (in mcores))/1000 mcores/core *CPU unit cost/core + Sum(Shortfall memory <0 (in MB))/1024 MB/GB *Memory unit cost/GB |
|
Additional Waste |
These are possible, additional savings that can be achieved, after implementing the Risk Removal recommendations. Calculated as ($Total Cost + Risk Removal - Immediate Savings - Optimal Cost). |
|
Optimal Spend |
This is the projected monthly spend if all of the recommendations are made. Calculated as ($Total Cost - $Total Estimated Waste). |
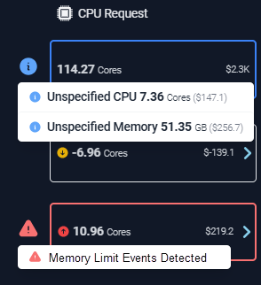
CPU Request and Memory Requests
This card lists the aggregated CPU and memory request for the selected scope of systems, broken down by the same optimization opportunities listed above. The values are colour-coded to easily identify savings and wasted resources.
Figure: CPU Memory Request Details
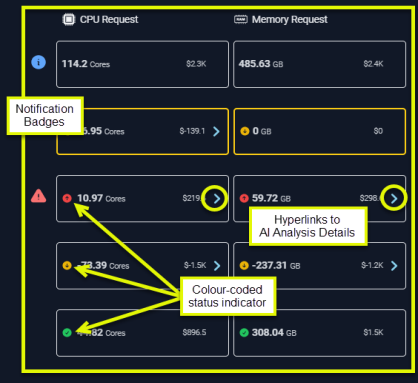
The blocks to the right of the bar chart show the corresponding, aggregated CPU and memory values for the systems that fall into each category. Click the arrow to open the AI Analysis Details page, with the relevant view selected. The hyperlink is only displayed for non-zero values.
|
Column |
CPU Value |
Memory Value |
|---|---|---|
|
Current Spend |
Total CPU Request (mCores) |
Total Memory Request (GB) |
|
Immediate Savings |
Total Surplus CPU Request (mCores) |
Total Surplus Memory Request (GB) |
|
Risk Removal |
Total Surplus CPU Request (mCores) |
Total Surplus Memory Request (GB) |
|
Optimal Cost |
Total Recommended CPU Request (mCores) |
Total Recommended Memory Request (GB) |
|
Additional Waste |
Total Surplus CPU Request (mCores) |
Total Surplus Memory Request (GB) |
CPU Requests are calculated as:
(Sum (Total Surplus CPU Request (mCores))/1000 mCores/Cores)
Memory Requests are calculated as:
(Sum (Total Surplus Memory Request (MB))/1024 MB/GB)
The cost is obtained by multiplying the above value by the CPU or memory Summary Tab.
Containers with Unspecified Settings
Costs for containers with unspecified CPU and memory request values, are calculated based on the recommended CPU and memory request values. The recommended setting is obtained from the Kubex analysis that is performed when adequate data has been collected.
When reporting on containers/manifests with unspecified request values, the recommended request setting is also used when determining total CPU and memory surplus or shortfalls. In cases where surplus values are reported, since an unspecified request is treated as 0, then the "surplus" appears as a negative value, indicating that the recommended CPU or memory request is greater than zero i.e. a shortfall.
Figure: Working with Unspecified Requests
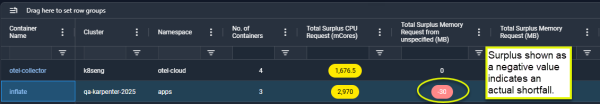
Containers with unspecified CPU and memory request values that are contributing to total spend, and are indicated, when you click on the badge.
Badges
Badges provide specific information related to the resource details. Click the badge to see the details.
|
Figure: CPU Requests and Memory Requests |
|
|
|
|